Territorial Observatory · LDB Arquitectura
Costa Rica territorial data for investors
Read the place with data before you buy a site or start the design. The Territorial Observatory by LDB Arquitectura maps the 492 districts and 84 cantons of Costa Rica with more than 500 variables. This page gathers, in English, the readings that matter most to investors and developers coming from abroad, with a link to each full map in Spanish.
Where construction is growing
Construction pulse by canton
Q2 2026 compared with Q2 2025 · updated every quarter
The Pulso de la construcción shows how many square meters are registered to build in each canton and district. It counts the projects filed with the CFIA to apply for a building permit, so it measures the intention to build, not finished work.
Housing grew 10.2%, industrial 17.1% and urban works 19.7%, while commercial fell 5.1%. The number of projects went from 8,843 to 9,222. By district, Tamarindo in Santa Cruz leads with 82,976 m².
Why it matters to an investor
It shows where new supply is coming and where demand for contractors and materials is rising. A large jump can also come from a single project. In 69 of the 222 districts with at least 2,000 m², one project holds more than half of the quarter’s area, so the map flags those cases.
Top cantons by registered area, Q2 2026
- San José207,278 m²
- Santa Cruz186,244 m²
- Alajuela174,272 m²
- San Carlos165,534 m²
- Tilarán83,068 m²one large project
- Grecia81,958 m²
- Heredia75,914 m²
- Pérez Zeledón72,704 m²
San José almost tripled its area from a year earlier, driven by housing. Alajuela fell 45.7% and still ranks third. Data from the CFIA Administrador de Proyectos de Construcción, processed by LDB Arquitectura.
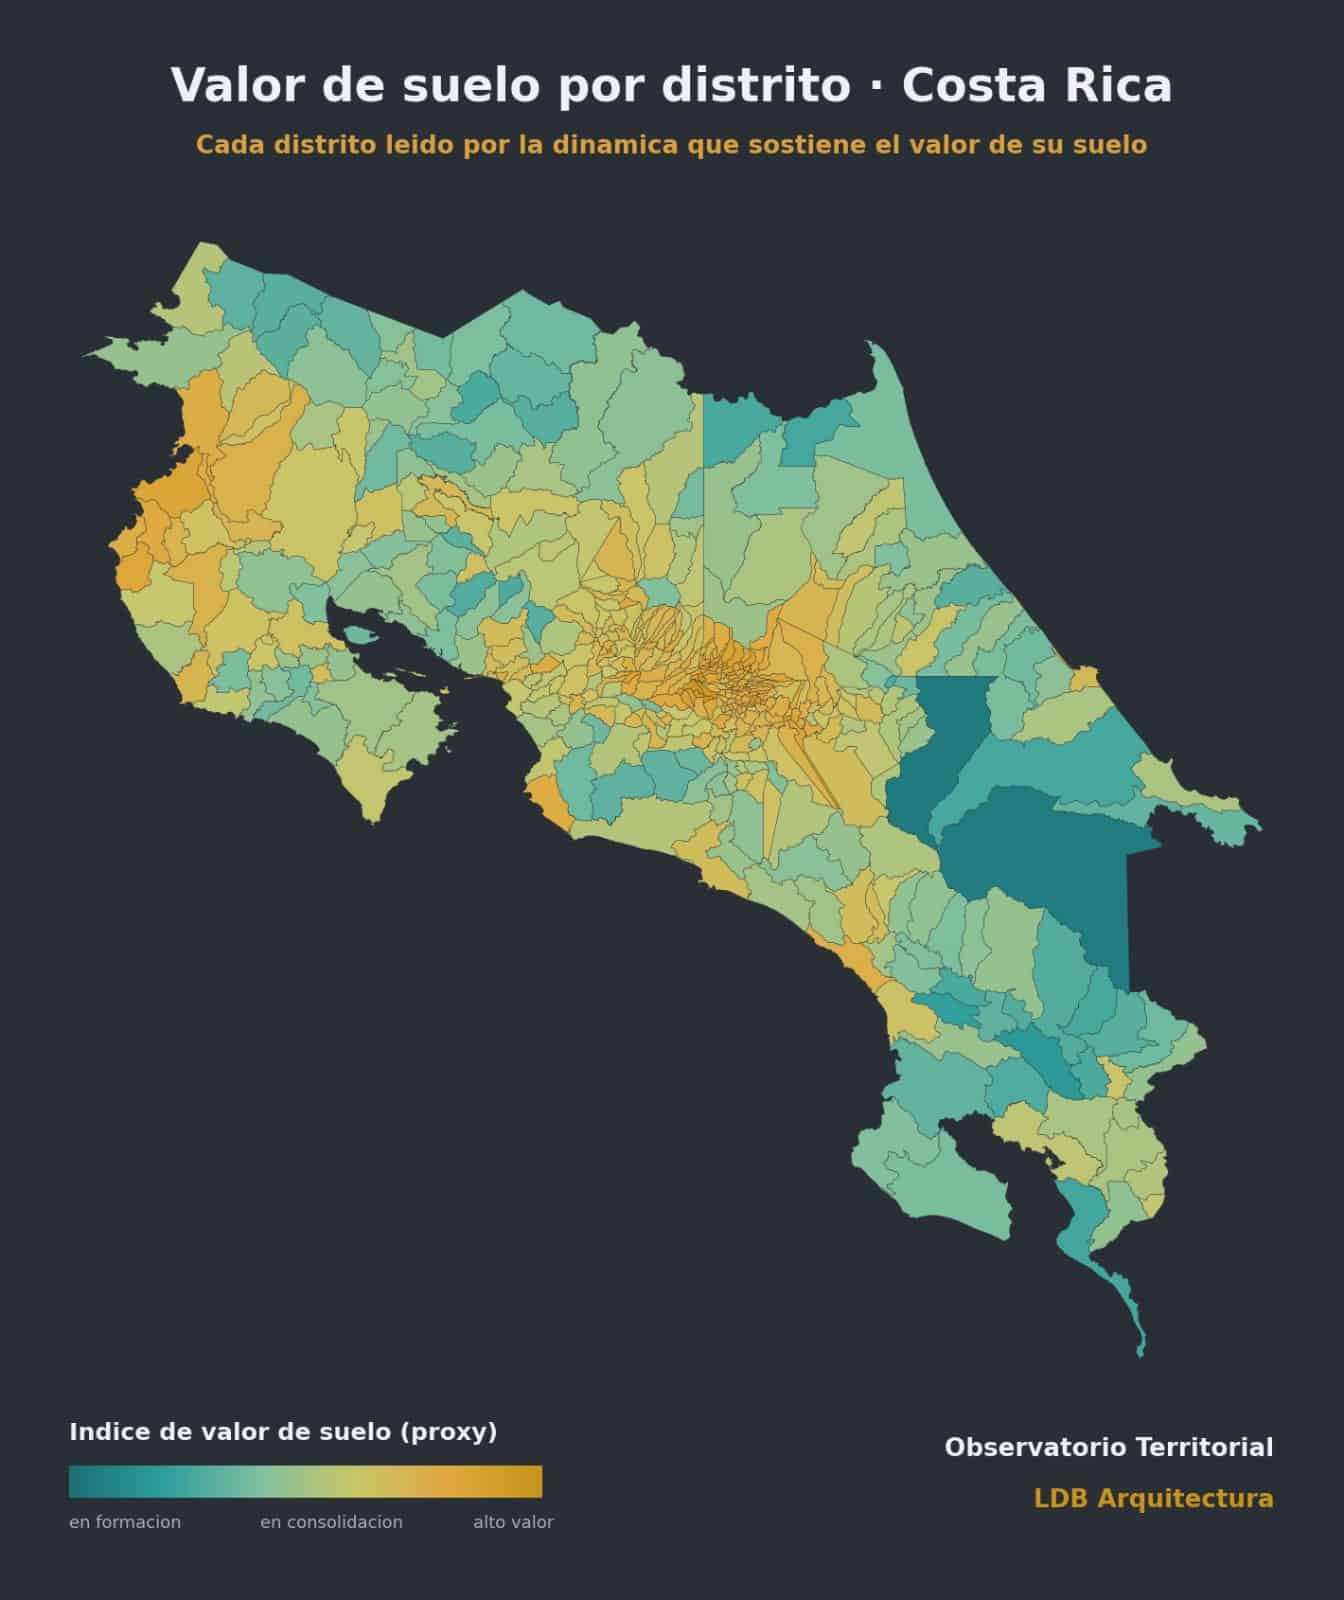
Land value by district
Land value index
Published June 24, 2026 · 492 districts
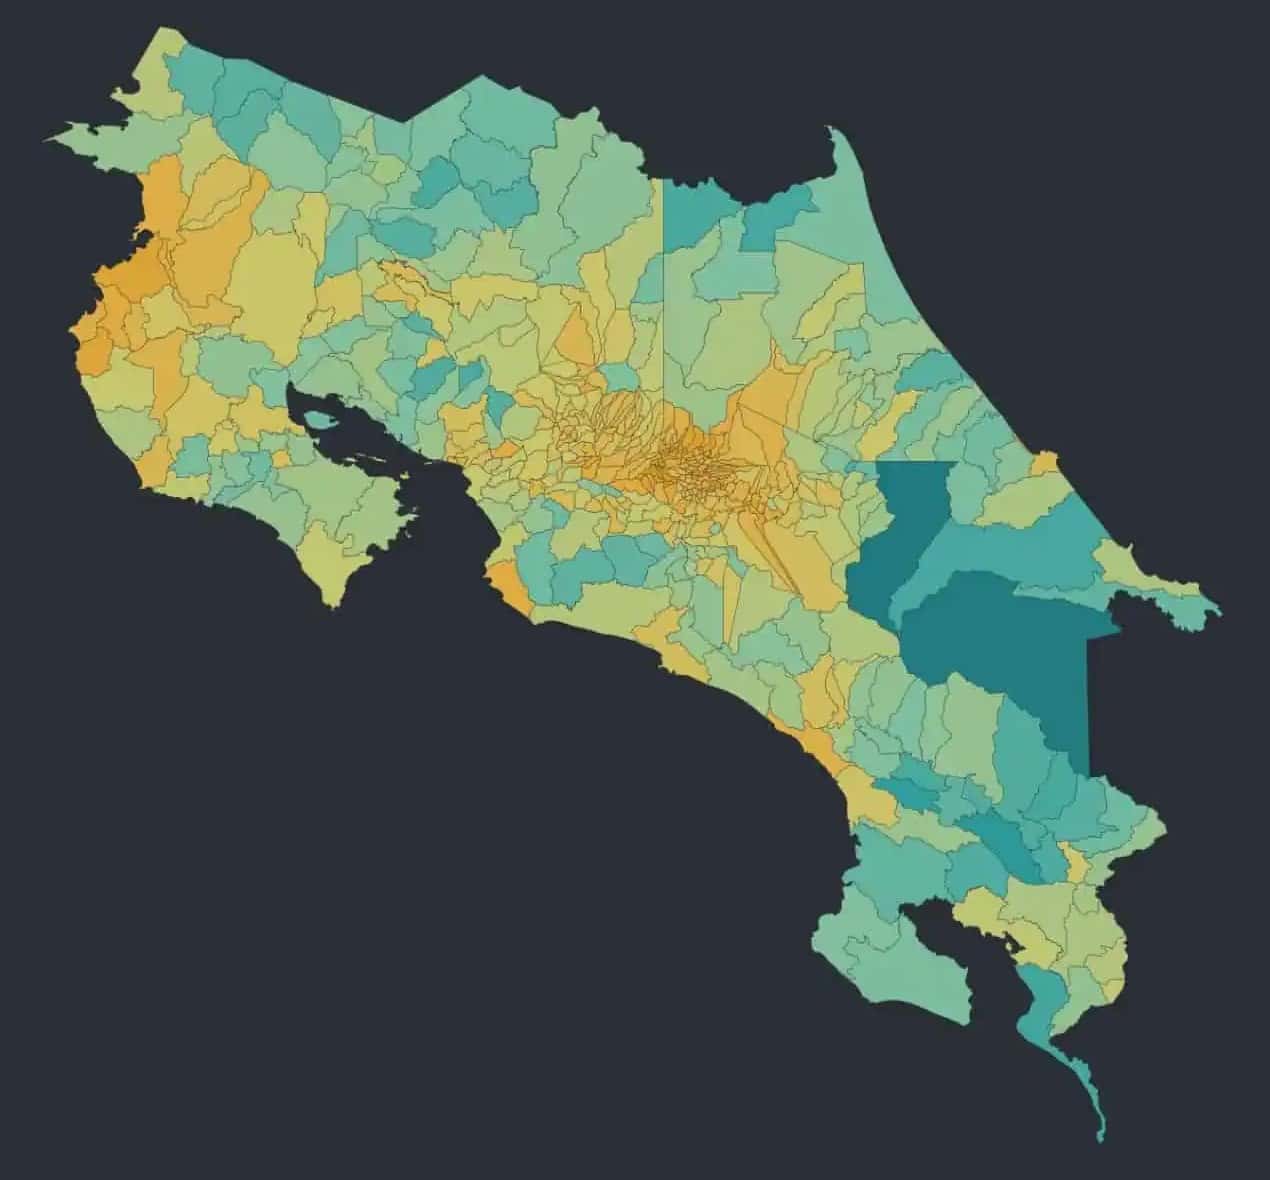
The map estimates land value district by district with a proxy index built from indicators of the Órgano de Normalización Técnica, the Costa Rican body that sets the technical standards for property valuation. Each district falls into one of three stages, land value in formation, in consolidation or high value.
The reading of the map is that land prices hold where public investment and private confidence met.
Why it matters to an investor
It helps you compare districts before making an offer and spot places where value is still forming. It is a relative index for analysis, not an appraisal. A specific lot still needs its own registry, land use and market review.
Water and housing demand
Water decides where the middle class will live
Published June 6, 2026 · 492 districts
Every district depends on a water operator with a different capacity. This map crosses water headroom with access to jobs to find where housing can take root.
The job centers of the Greater Metropolitan Area run their aqueducts at the limit. Flores, Barva, Santo Domingo, Atenas and Palmares combine water headroom with access to employment.
Why it matters to an investor
A water availability letter is one of the inputs for a building permit. A site without water capacity can stall a housing project however strong the demand. The map points to where demand and water meet.
Operator and headroom are modeled with geographic and demographic rules for analysis. Base sources AyA, ESPH, Dirección de Aguas of MINAE, SENARA, INEC and SNIT.
See the full map (in Spanish)
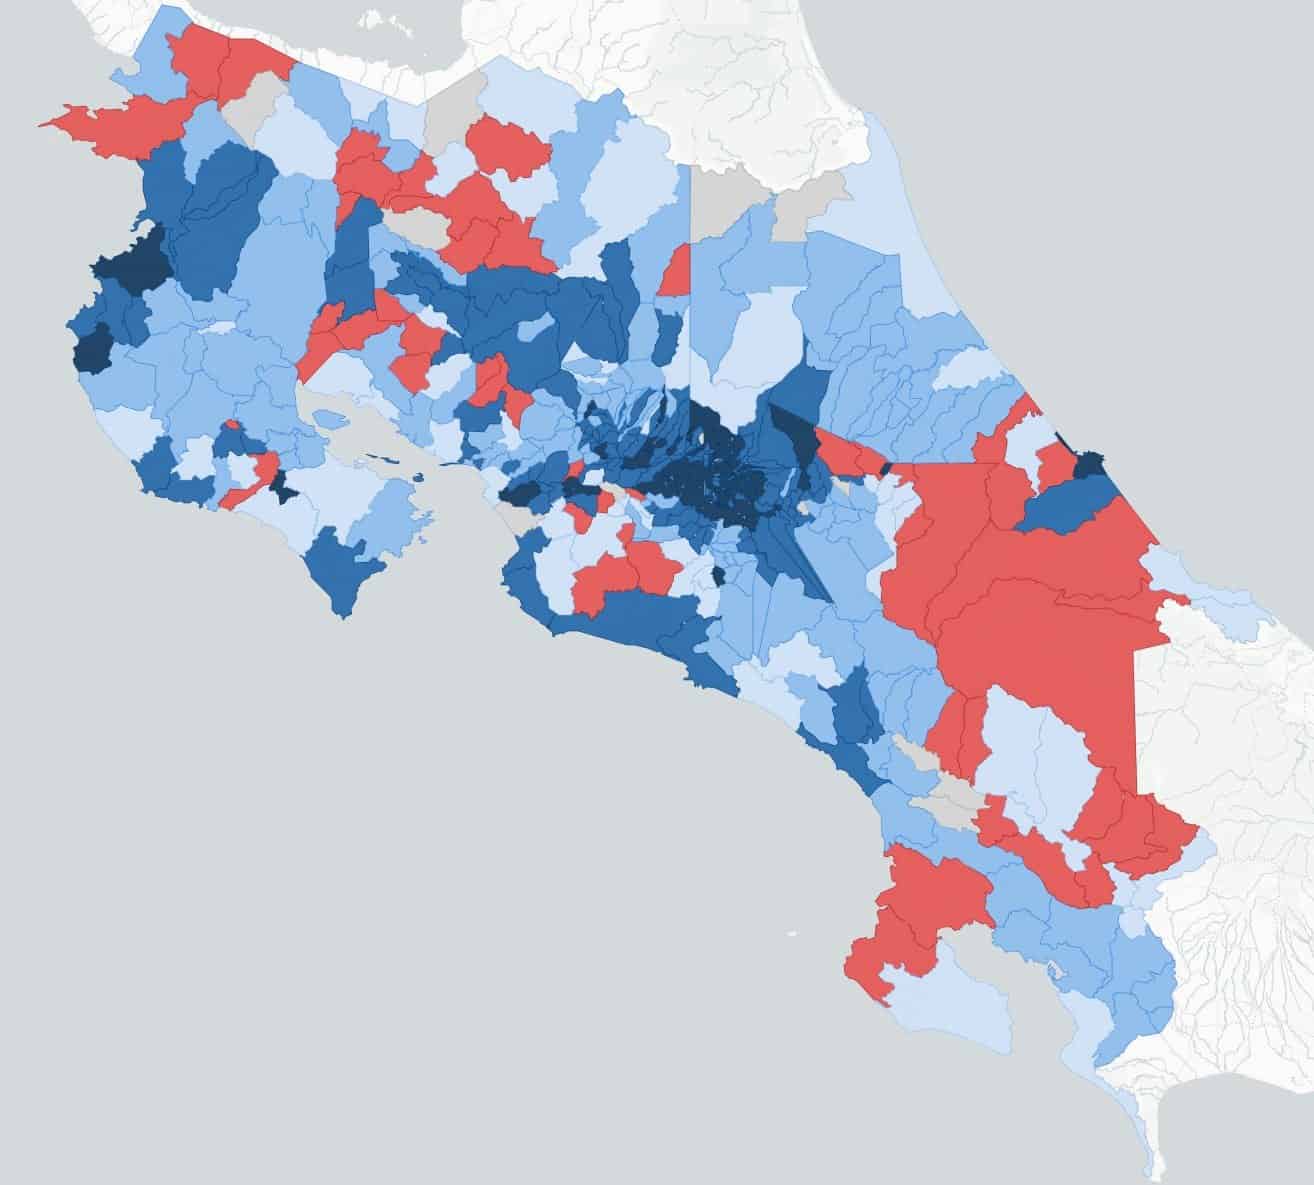
Internet connectivity
Digital divide by district
Published May 30, 2026 · SUTEL broadband data 2024
The map shows the download speed in each district, based on open data from SUTEL, the telecommunications regulator.
Talamanca, Upala, Los Chiles, Buenos Aires and Coto Brus lead the gap.
Why it matters to an investor
Connectivity decides which places can receive new residents, remote workers, guests and offices. For a hotel or a home outside the metropolitan area, check the district before you commit to the site.
Employment by canton
Women’s employment by canton
Published May 9, 2026 · INEC Continuous Employment Survey, Q1 2026
The map estimates the employment rate of women in each canton and shows where the national training institute, INA, has a presence.
Where childcare, transport and nearby training are missing, women absorb what the infrastructure does not solve.
Why it matters to an investor
It reads the available workforce near a site. For an office, a hotel or a plant, a canton with low employment and training nearby can mean people ready to work close to home.
Cantonal rates are an LDB estimate based on the INEC survey.
See the full map (in Spanish)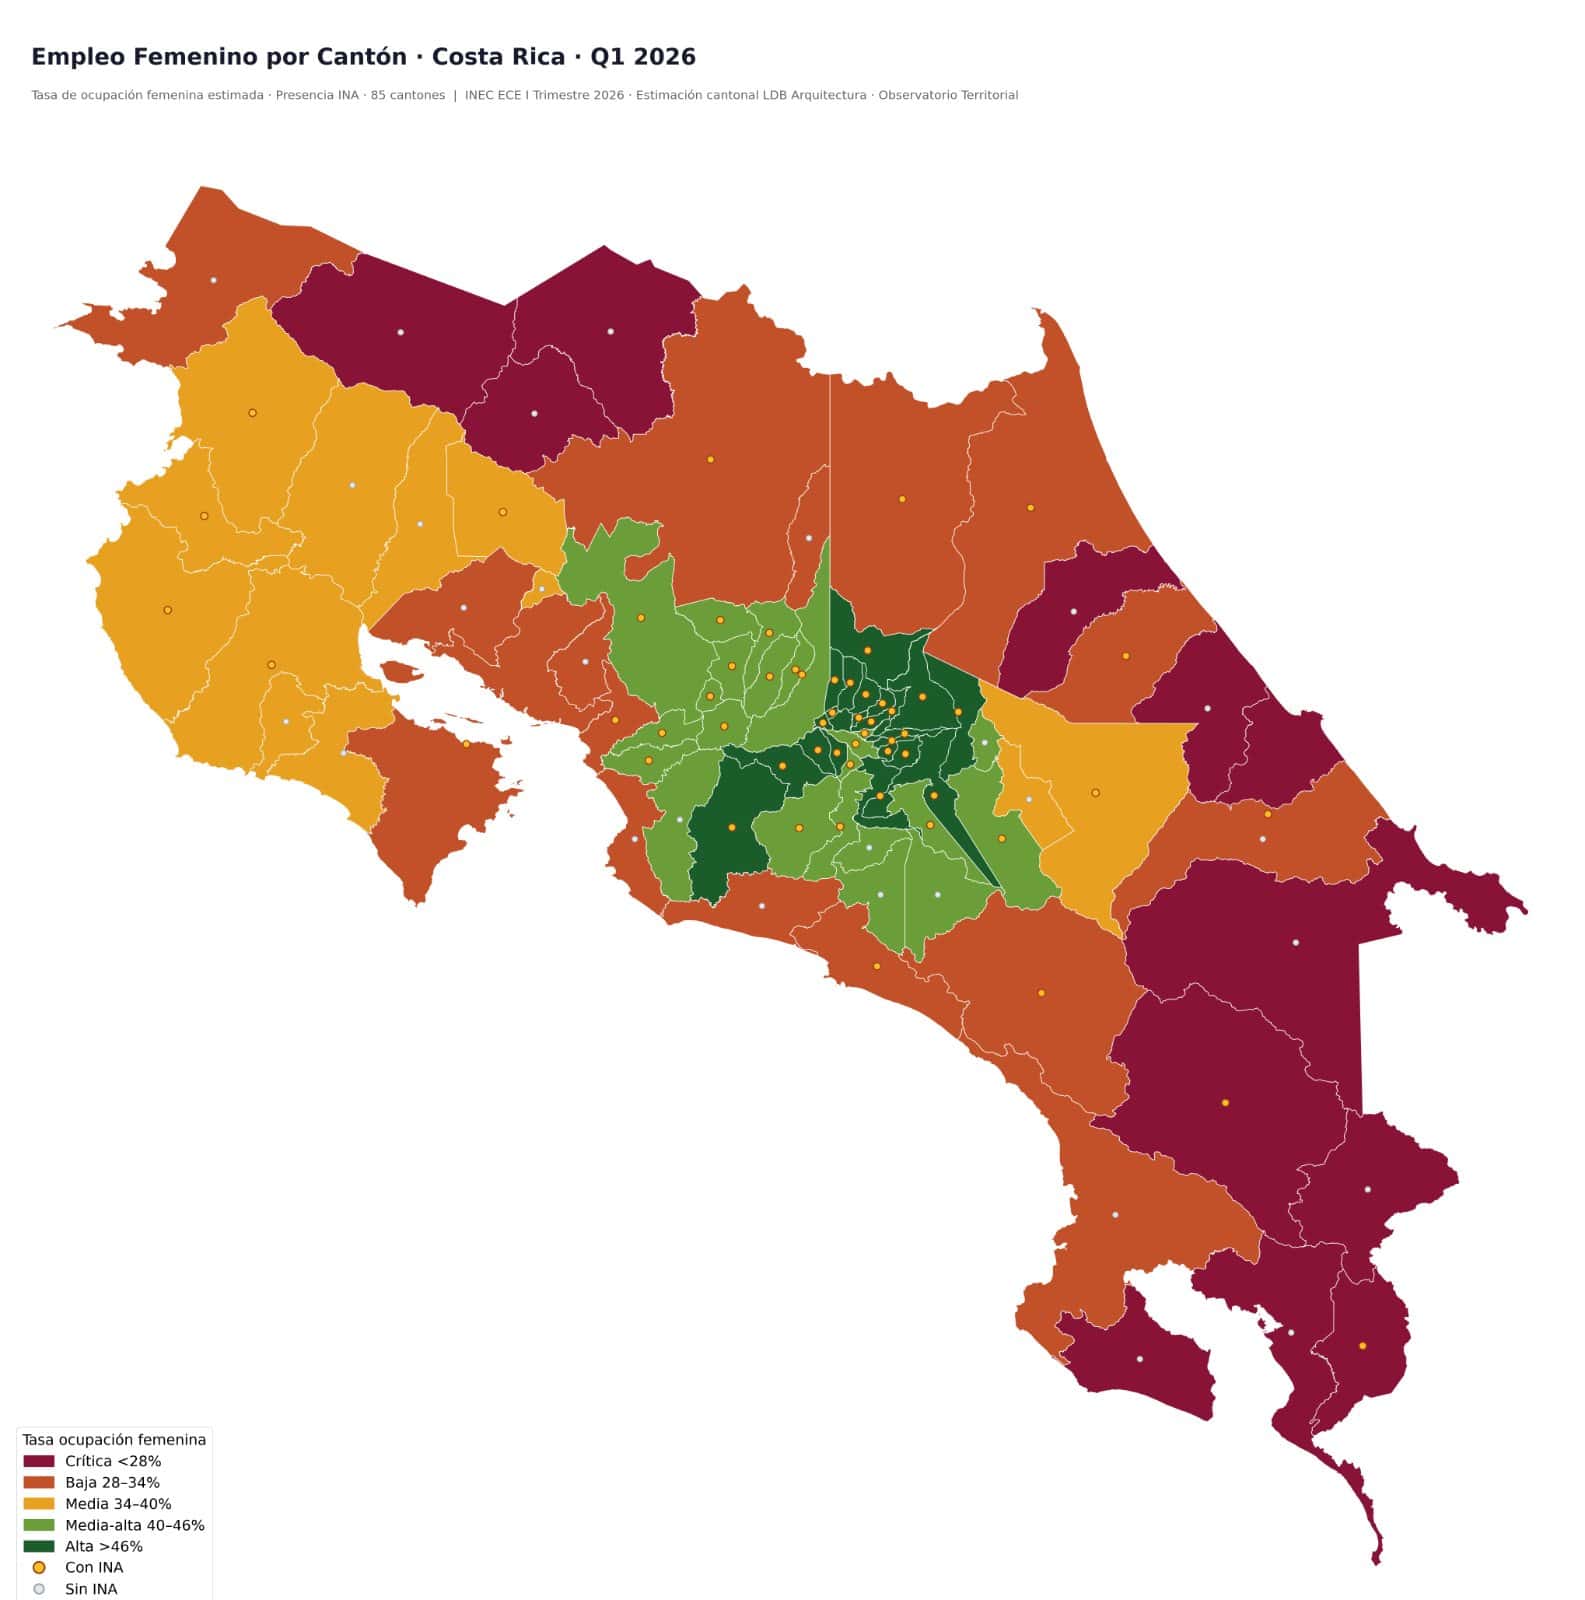
More in the Observatory, in Spanish
Other maps read childcare, export vocation, dependence on public health care, the electricity grid, trade capacity under the CPTPP and the ports of Caldera and Moín. The Atlas brings them together and the Kora explica shorts explain key ideas about the city in a few minutes.
Open the Observatory (in Spanish)How LDB uses it in a project
Before we propose anything, we read the place. The Observatory is the first layer of that reading. Then the site itself takes over.
- 1Reading the siteThe district data, the registry report, the cadastral plan, setbacks from rivers or highways, water and electricity availability and the terrain and its risks.
- 2What fits on the siteLand use, site coverage and height define how many square meters the lot can hold. We test the program against them and give a first cost estimate from our own price database.
- 3The permit routeWhich studies, institutions and timelines apply, from land use to the municipal building permit, including environmental clearance with SETENA when needed.
Our tailored preliminary study, Primer paso a la medida, puts these three readings together for a specific lot and is delivered in one week. The full process, from site to handover, is in the guide to building in Costa Rica. For a first figure, use the construction cost calculator. To learn more about the office, see About LDB Arquitectura or our work for offices, retail and hotels.
Land value index by district (proxy)
Observatorio Territorial
LDB Arquitectura
Frequently asked questions
Where does the data come from?
From public sources cited on each map, such as the CFIA Administrador de Proyectos de Construcción for the construction pulse, INEC, SUTEL, AyA, the indicators of the Órgano de Normalización Técnica and the official boundaries of the Instituto Geográfico Nacional. LDB Arquitectura processes and crosses them. Some layers, such as land value, water headroom and cantonal employment, are estimates modeled for analysis and say so on the map.
How often is it updated?
The construction pulse is updated every quarter when the CFIA publishes the next cut, with about one month of lag. The Observatory publishes new maps through the year and each one carries its date. The figures on this page show the date of the map they come from.
Can I get a reading for a specific lot?
Yes. Our tailored preliminary study, Primer paso a la medida, reviews the registry report, the cadastral plan, land use, setbacks, utilities and terrain of your lot, with a first cost estimate. It is delivered in one week. Write to us with the location and what you want to build.
Is it available in English?
The maps and articles of the Observatory are in Spanish. This page summarizes the key readings in English. We answer email and WhatsApp messages in English and can walk you through any map.
Do you work with foreign investors?
Yes. We work with companies and developers opening an office, a store or a hotel in Costa Rica. Clients include Evertec, Findasense and AutoStar. We design, prepare the permits and inspect construction. LDB does not build.
Figures come from the dated Observatory maps and the construction pulse linked in each section. They are a reference for planning, not an appraisal or investment advice.
Let’s read your site together
Tell us where the site is and what you want to build. Write to us on WhatsApp or at [email protected].
WhatsApp +506 7079-6388[email protected]Contact form